GGS Market Observations

June 12, 2023

Since March 2020, the global economy has undergone multiple dramatic changes driven primarily by adaptations of businesses, consumers, employees, and governments to the COVID-19 pandemic. Some examples:

  • Severe lockdowns followed by staggered reopening policies
  • Massive government stimulus followed by fiscal and monetary tightening
  • Huge demand increases for consumer goods and supply chain gridlock followed by the current “freight recession” 1
  • Collapse in travel followed by significant recovery 2
  • Worries about deflation followed by the highest inflation rate since 1980 3

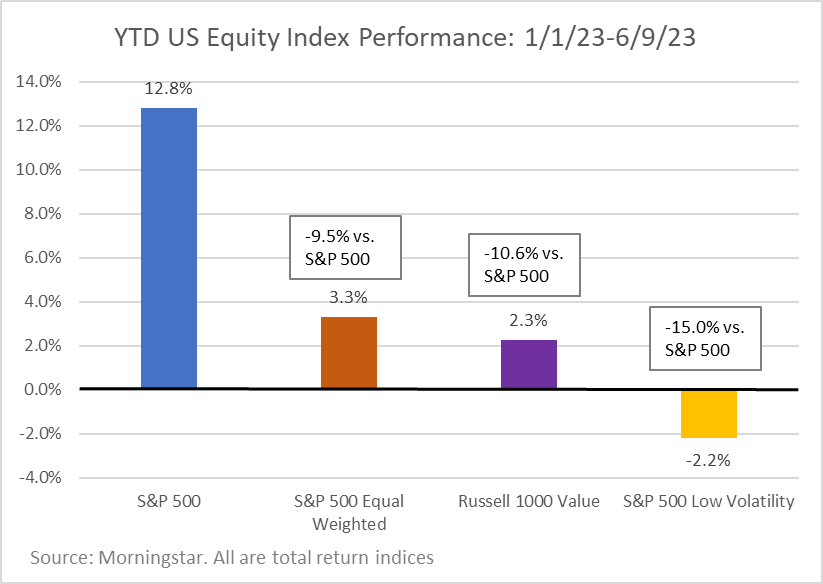
The shifting economic backdrop continues to this day and has led to distortions in economic data, with some metrics showing a US economy currently in recession while others show continued healthy growth.This unusual economic environment has also led to significant stock price performance dispersion between industries and companies.5 Looking at the S&P 500 year-to-date (YTD), just 10 of the 500 stocks in the index have driven 90% of the gains (Alphabet, Amazon, AMD, Apple, Broadcom, Meta, Microsoft, NVIDIA, Salesforce, Tesla).6 These companies, all of which could be considered Technology stocks, carry a high weight in the index and not owning them in the requisite size has led to relative underperformance for many active managers.7

In fact, we are currently experiencing the largest YTD underperformance on record for the S&P 500 Equal Weighted TR Index relative to the market cap-weighted S&P 500 TR Index.8 Similarly, there has been abnormal YTD underperformance of lower-priced value stocks and more defensive, low-volatility stocks, both of which are factors we favor in our individual stock selection as they have historically led to risk-adjusted outperformance.9

Looking at the history of these indices relative to the S&P 500, the only larger calendar year percentage gaps (positive or negative) have occurred during extreme market years such as the 1998-2001 Tech Bubble, the 2008-2009 Great Financial Crisis, and the 2020 COVID-19 Pandemic.10 Importantly, these three indices have all historically rebounded after periods of severe underperformance: 11

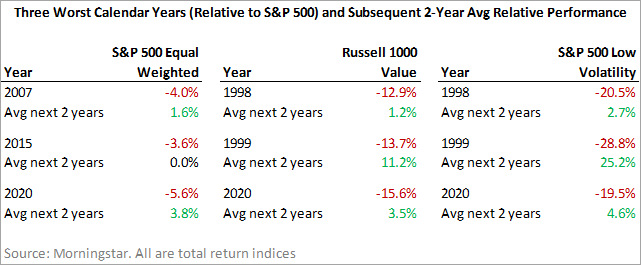
Bottom line, this has been an unusual start to the year for the US stock market. When extreme relative performance gaps between US equity market indices do occur, they often appear to be the “new normal.” Yet, history shows that they tend to reverse over subsequent years as the underlying economic situation shifts or as overly optimistic/pessimistic forecasts and valuations fail to be realized. Therefore, we believe it is critical to stick to our core investment strategy during years like 2023 even as it is tempting to make significant changes and chase the types of companies currently in favor. We continue to believe that our disciplined process of owning high-quality companies trading at attractive valuations is the best strategy to help clients succeed in their long-term investing goals.

Footnotes

1 https://www.cnbc.com/2023/04/24/economy-is-in-a-freight-recession-with-china-trade-heading-lower.html

https://www.tsa.gov/travel/passenger-volumes

3 https://fred.stlouisfed.org/series/CPALTT01USM657N

Real Gross Domestic Income, which in theory should equal Real Gross Domestic Product (GDP) but uses different source data, has been negative for both Q4’22 and Q1’23 even while Real GDP has been positive – per Moody’s 6/8/23 Weekly Market Outlook. Likewise, the S&P Global US Manufacturing PMI has shown contraction six of the past seven months, while the S&P Global US Services PMI and most employment data continue to be strong. Real disposable personal income per capital remains well below 2021 levels: https://fred.stlouisfed.org/series/A229RX0

https://www.spglobal.com/spdji/en/documents/performance-reports/dashboard-dispersion-volatility-correlation.pdf

Bernstein Research: Tech Strategy: The most concentrated market ever… What does history say happens next? 6/12/2023

https://www.thinkadvisor.com/2023/04/05/active-fund-managers-off-to-lousy-start-this-year/

The S&P 500 Equal Weight TR Index, as the name implies, gives all 500 companies in the index the same weighting (rebalanced quarterly). The 9.5% gap, if it holds through December, would be the largest calendar year underperformance of the S&P 500 Equal Weighted TR Index relative to the S&P 500 TR Index since Morningstar data begins with the full year 2004. This recent WSJ article states that this is true YTD going back to 1989 as well: https://www.wsj.com/livecoverage/stock-market-today-dow-jones-05-30-2023/card/s-p-500-outperforms-equal-weighted-index-by-biggest-margin-year-to-date-on-record-T2xYlLSqyWOfd1TUVO6m

Lower-priced value stocks are measured by the Russell 1000 Value TR Index. More defensive, low volatility stocks are measured by the S&P 500 Low Volatility TR Index. For long-term, risk-adjusted outperformance, see our preferred academic paper on this subject called Replicating Anomalies https://papers.ssrn.com/sol3/papers.cfm?abstract_id=2961979

10 Using Morningstar data, the first full calendar year of data for the indices is as follows: S&P 500 TR Index: 1971, S&P 500 Equal Weighted TR Index: 2004, Russell 1000 Value TR Index: 1988, S&P 500 Low Volatility TR Index: 1991

11 For example, looking at the bottom left section of the table, the S&P 500 Equal Weighted TR Index was up 12.8% in 2020 versus 18.4% for the S&P 500 TR Index, or -5.6% relative performance. The S&P 500 Equal Weighted TR Index subsequently outperformed the S&P 500 TR Index by +0.9% in 2021 and +6.7% in 2022, an average of +3.8% per year.

Galvin, Gaustad & Stein (“GG&S”) is an SEC registered investment adviser located in Scottsdale, Arizona. GG&S and its representatives are in compliance with the current registration and notice filing requirements imposed upon SEC registered investment advisers by those states in which GG&S maintains clients. GG&S may only transact business in those states in which it is notice filed, or qualifies for an exemption or exclusion from notice filing requirements. GG&S’s web site is limited to the dissemination of general information regarding its investment advisory services to United States residents residing in states where providing such information is not prohibited by applicable law. Accordingly, the publication of GG&S’s web site on the Internet should not be construed by any consumer and/or prospective client as GG&S’s solicitation to effect, or attempt to effect transactions in securities, or the rendering of personalized investment advice for compensation, over the Internet. Furthermore, the information resulting from the use of tools or other information on this Internet site should not be construed, in any manner whatsoever, as the receipt of, or a substitute for, personalized individual advice from GG&S. Any subsequent, direct communication by GG&S with a prospective client shall be conducted by a representative that is either registered or qualifies for an exemption or exclusion from registration in the state where the prospective client resides. For information pertaining to the registration status of GG&S, please contact the United States Securities and Exchange Commission on their web site at www.adviserinfo.sec.gov. A copy of GG&S’s current written disclosure statement discussing GG&S’s business operations, services, and fees is available from GG&S upon written request. GG&S does not make any representations as to the accuracy, timeliness, suitability, completeness, or relevance of any information prepared by any unaffiliated third party, whether linked to GG&S’s web site or incorporated herein, and takes no responsibility therefore. All such information is provided solely for convenience purposes only and all users thereof should be guided accordingly.

Certified Financial Planner Board of Standards Inc. (CFP Board) owns the certification marks CFP and CERTIFIED FINANCIAL PLANNER in the U.S., which it awards to individuals who successfully complete CFP Board's initial and ongoing certification requirements.

CFA and Chartered Financial Analyst are registered trademarks owned by CFA Institute. GIPS® is a registered trademark of CFA Institute. CFA Institute does not endorse or promote this organization, nor does it warrant the accuracy or quality of the content contained herein. GIPS® compliant performance information for GGS’s strategies is available upon request.

Past performance is no guarantee of future results and may have been impacted by market events and economic conditions that will not prevail in the future. This site/blog contains certain forward‐looking statements (which may be signaled by words such as “believe,” “expect” or “anticipate”)which indicate future possibilities. Due to known and unknown risks, other uncertainties and factors, actual results may differ materially from the expectations portrayed in such forward‐looking statements. As such, there is no guarantee that the views and opinions expressed in this letter will come to pass.

ACCESS TO THIS WEB SITE IS PROVIDED FOR INFORMATIONAL PURPOSES ONLY AND WITHOUT ANY WARRANTIES, EXPRESSED OR IMPLIED, REGARDING THE ACCURACY, COMPLETENESS, TIMELINESS, OR RESULTS OBTAINED FROM ANY INFORMATION POSTED ON THIS WEB SITE OR ANY THIRD PARTY WEB SITE LINKED TO THIS WEB SITE.

Relationship Summary (ADV Part 3)